Descriptions of Wombats Year 1
Reply


What statements can you make from the following graphic?

Cartographer/designer Philippe Rekacewicz, UNEP/GRID-Arendal
It is predicted that Niger will possibly have water stress by 2025.
Khushi
By 2025 Morocco will have very scarce water levels. Morocco might possibly be below 1 000m3 per person per year.
Xander
The water scarcity in Lybia might be less than 1 000m3 per person per year, by 2025.
Andre
In 2025 Egypt might have less than 1 000m3 of water per capita.
Daisy
Researchers predict that Niger will have water stress by 2025.
The map shows that there is a possible water scarcity in the coastal regions of Africa.
Rancis
In 2025 Algeria will probably have less than 1 000m3 of water per person per year. This means they might be in water scarcity.
Elise
From this chart it is predicted that Egypt will possibly have water scarcity by 2025.
Olivia
By 2025 Libya could have extremely scarce rainfall that will go down to 1000m3/capita/year.
Researchers predict that by 2025 Egyppt will have less than 1000m3 per capita per year.
Camden
By 2025, it is estimated that people living in Tunisia will have less than 1 000m3 of water per year. This high water scarcity will affect all life in the country.
Ruby
In 2025 Libya is highly likely to have lesss than 1 000m3of water per person per year.
Lola
In the year 2025 estimates have shown water availability will be extremely scarce in Egypt. Only under 1 000m3/capita/year. Water usage will most likely be strict in Egypt by 2025.
Jasper
Water could be extremely scarce in Egypt by 2025. There could be as little as 1 000m3 of water per capita, per year. This could also bring stress to the country.
Candace
In 2025 Nigeria is possibly going to be under stress having only 1 000 to 1 700m3 of water per person per year.
Audrey
In 2025, it is most likely that Niger will have 1000-1700m3/ capita/year of water which will put a lot of stress on the country.
Oliver
What can you infer from this graphic?

Yemen might withdraw more than 40% of the total water available by 2025.
Andre
In 2025 Egypt might be using more than 40% of the total water available.
Daisy
In 1995 Niger consumed from 20% to 10% of water they have and by 2025
Niger will possibly consume 40 – 20%.
Rancis
Since 1995 Egypt has been withdrawing more than 40% of their total available water. It is predicted that this will last until 2025 at least.
Stef
In 2025, Nigeria will most likely have only 1000m3 of water per person for a whole year which means they will be under stress.
Daniela
Since 1995 Algeria has withdrawn from 40% to 20% of its available water. It is predicted that in 2025 it will be using more than 40% of its available water.
Elise
In 1995, the water withdrawn from the total amount of available water in Egypt was more than 40%. According to the data from researchers, there is a chance that this may remain the same by 2025.
Mai
Researchers predict that Egypt will withdraw more than 40% of their total available water by 2025.
Camden
Scientists predict that Gambia will withdraw less than 10% of their total available water.
Finn
In 1995, Tunisia was withdrawing more than 40% of the water available in their environment. It is estimated that this will still be the same in 2025.
Ruby
Key Inquiry Questions:
What can you interpret from these two graphics?
Cartographer/designer Philippe Rekacewicz, UNEP/GRID-Arendal
http://www.grida.no/graphicslib/detail/freshwater-stress-and-scarcity-in-africa-by-2025_4036
http://www.unep.org/dewa/vitalwater/jpg/0400-waterstress-EN.jpg
http://www.unep.org/dewa/vitalwater/article141.html
Curriculum Content:
Investigate the main causes of rainfall and apply your knowledge to explain the seasonal rainfall patterns in Adelaide with a place significantly higher/ lower.
Interpret the spatial distribution of rainfall in Australia and compare it with the distribution of that in other countries.
Compare the quantity and variability of rainfall, runoff and evaporation in Australia with that in other countries.
| Place | Jan | Feb | Mar | Apr | May | Jun | Jul | Aug | Sept | Oct | Nov | Dec |
| Temp. Max (°C) | ||||||||||||
| Temp. Min(°C) | ||||||||||||
| Rainfall (mm) |
Collect data related to the West Asian or North African country/ city of your choice.
http://www.worldweather.org/en/home.html
Compare with Australia and other countries.
Investigate the causes of water scarcity
Environmental Protections:Source: Water Journal : Water Journal November 2015, Page 30
Discuss the advantages and disadvantages of strategies to overcome water scarcity, for example:
Stormwater harvesting article: Source: Water Journal : Current May 2016, Page 76
Examine why water is a difficult resource to manage, for example
Get Connected Teacher Resources:
http://globalwords.edu.au/units/Neighbours-JSY7-2014/index.html
https://www.worldvision.com.au/get-involved/school-resources/detail/get-connected-water-in-the-world
http://webworld.unesco.org/water/ihp/publications/waterway/webpc/pag9.html
http://www2.worldwater.org/conflict/map/
http://www2.worldwater.org/conflict/list/
http://www.un.org/en/udhrbook/#1
GOOD News: Hippo Rollers from hipporoller on Vimeo.
SOLO So far, more to be added
SOLO Taxonomy –Geography term2 Yr7
Where do wombats live?
What else can you learn from reading this map?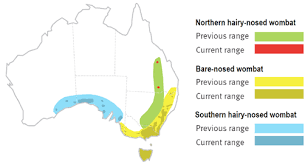
northern-hairy-nosed-wombat-factsheet
Here is a descriptive report (information report) about the Red bellied piranha. Let’s use a similar structure to write a descriptive report about wombats. How would you like to present your report? Video, PowerPoint, Word? Think about your audience and purpose.
Has your child already finished the Premier’s Reading Challenge?
We aim to have 100% complete the Premier’s Reading Challenge at NPS.
If so…
Your child might like to have-a-go at The Olympic Reading Challenge. Students can choose from a variety of ‘events’ such as:
• Artistic Gymnastics – Read 10 picture books
Or
• Marathon – Read for 1 hour straight
Or
• Relay – You and 3 friends read the same book
Students will have until 26th August to complete as many events as they like.
Your support in encouraging children to read, understand and enjoy the books they bring home as part of this challenge will be valued. Please help your child to record their achievements, sign and send back to school the form by 26th August so that we can celebrate achievements during Book Week next term.
Download form here:
Olympic Reading Challenge recording form

Water shortage in Kenya
Water Scarcity
http://abcspla.sh/c/618210
East Timor
Niger
http://www.globaleducation.edu.au/countries/niger.html
Water and Sanitation
http://www.globaleducation.edu.au/global-issues/gi-water-and-sanitation.html
Water – A Case Study on Flores
https://www.worldvision.com.au/get-involved/school-resources/detail/water-and-human-wellbeing-(years-7-10)
https://www.worldvision.com.au/docs/default-source/school-resources/dvd-activity-water.pdf?sfvrsn=0
SOLO so far (to be added to)
SOLO Taxonomy –Geography term2 Yr7